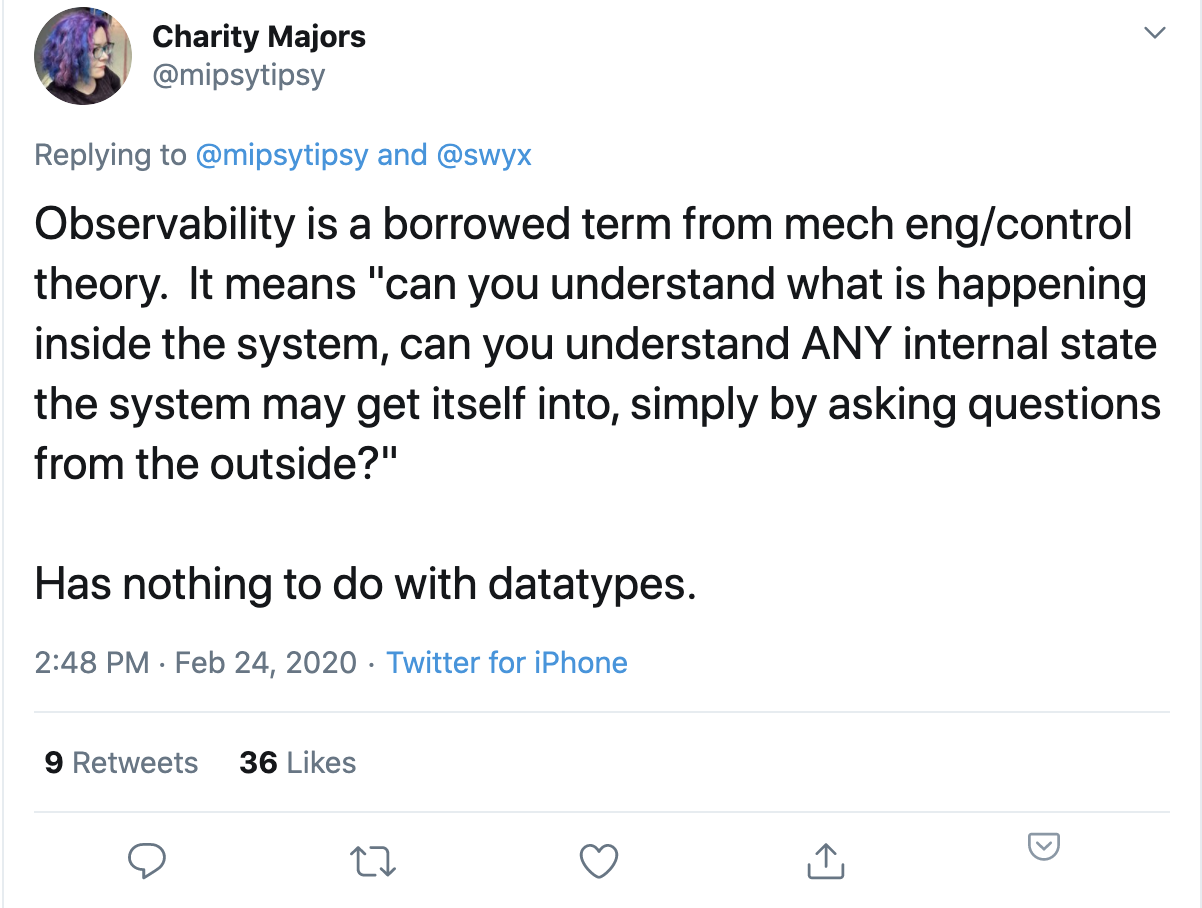
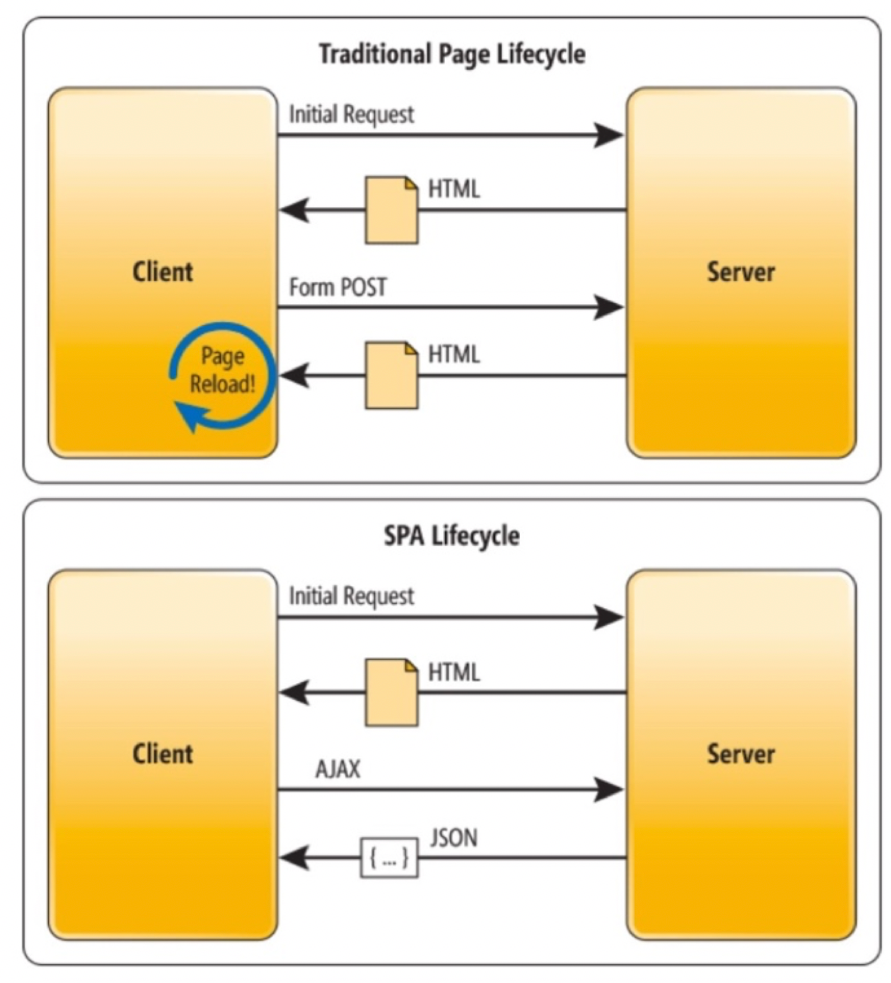
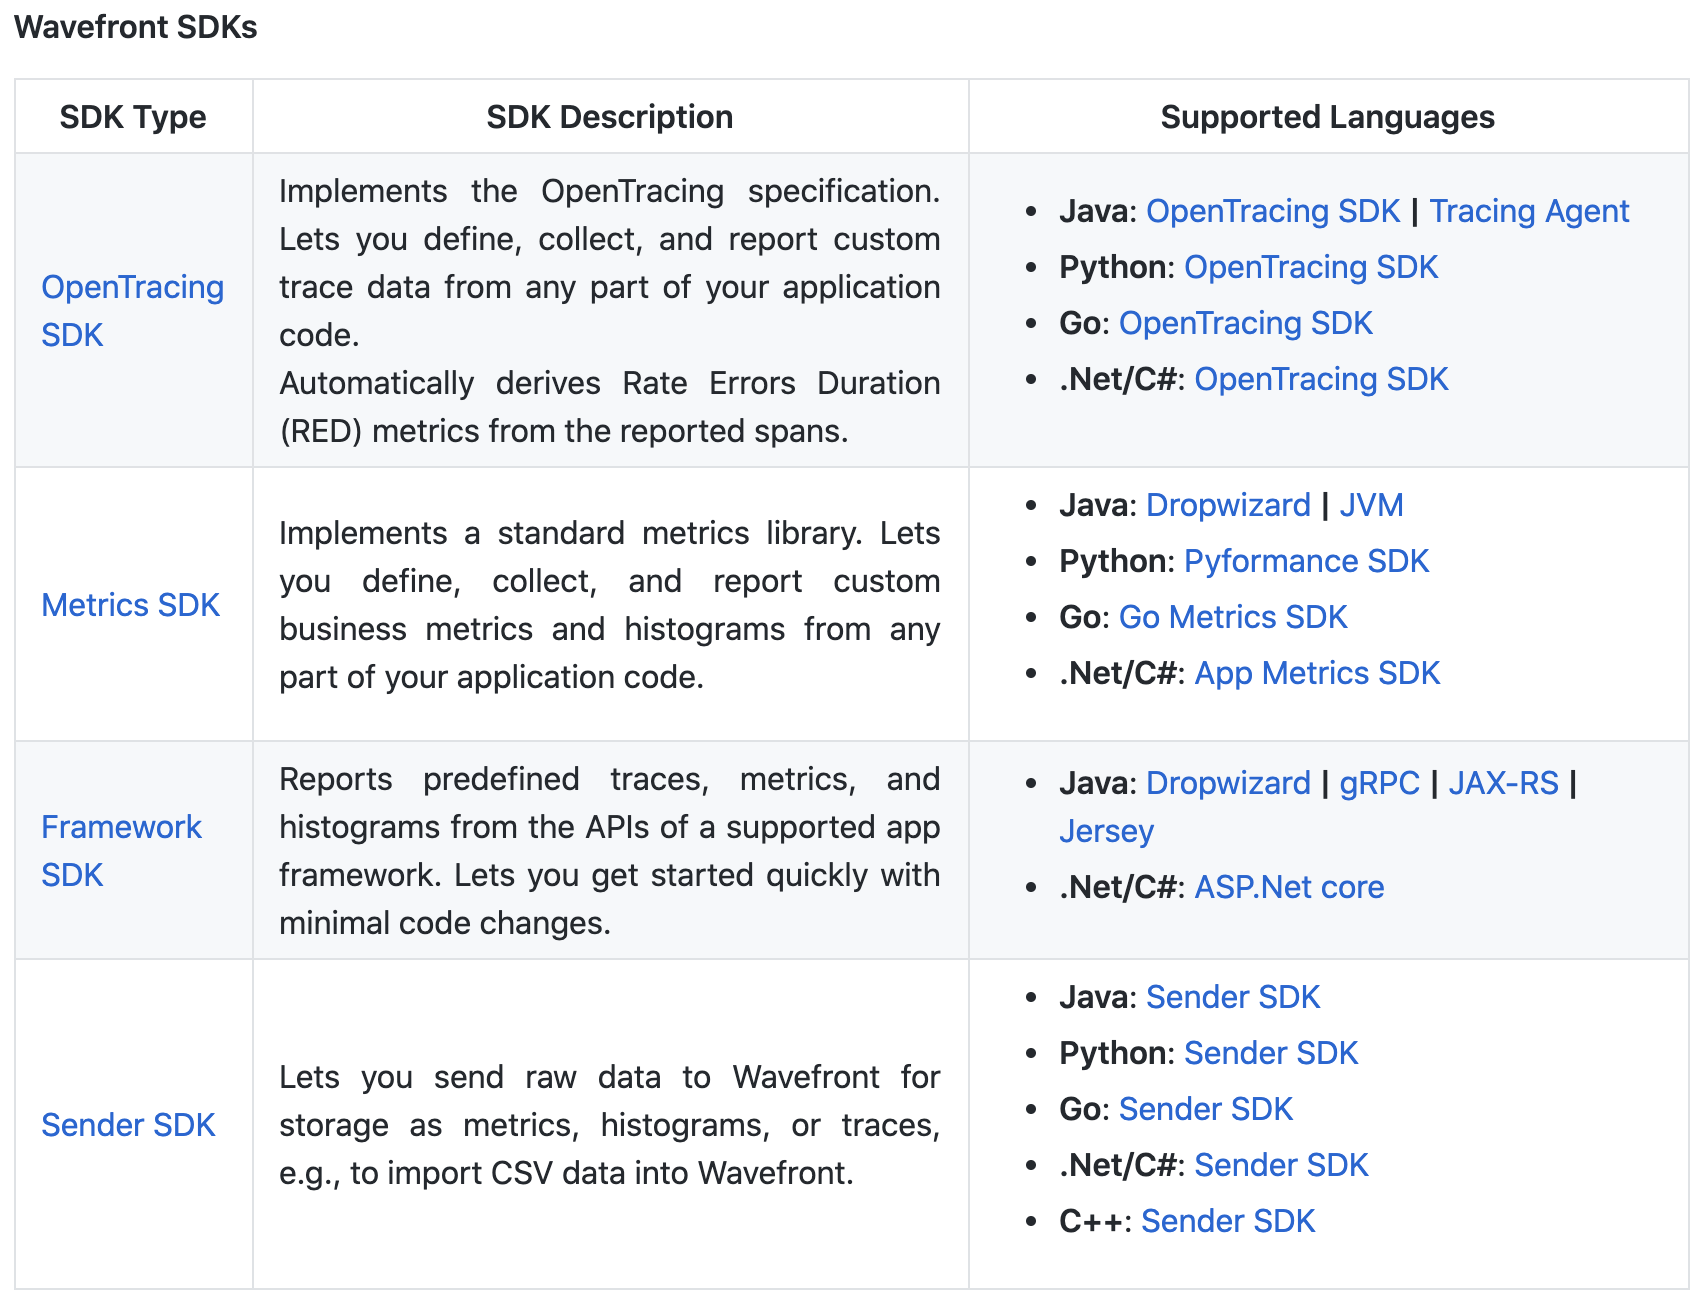
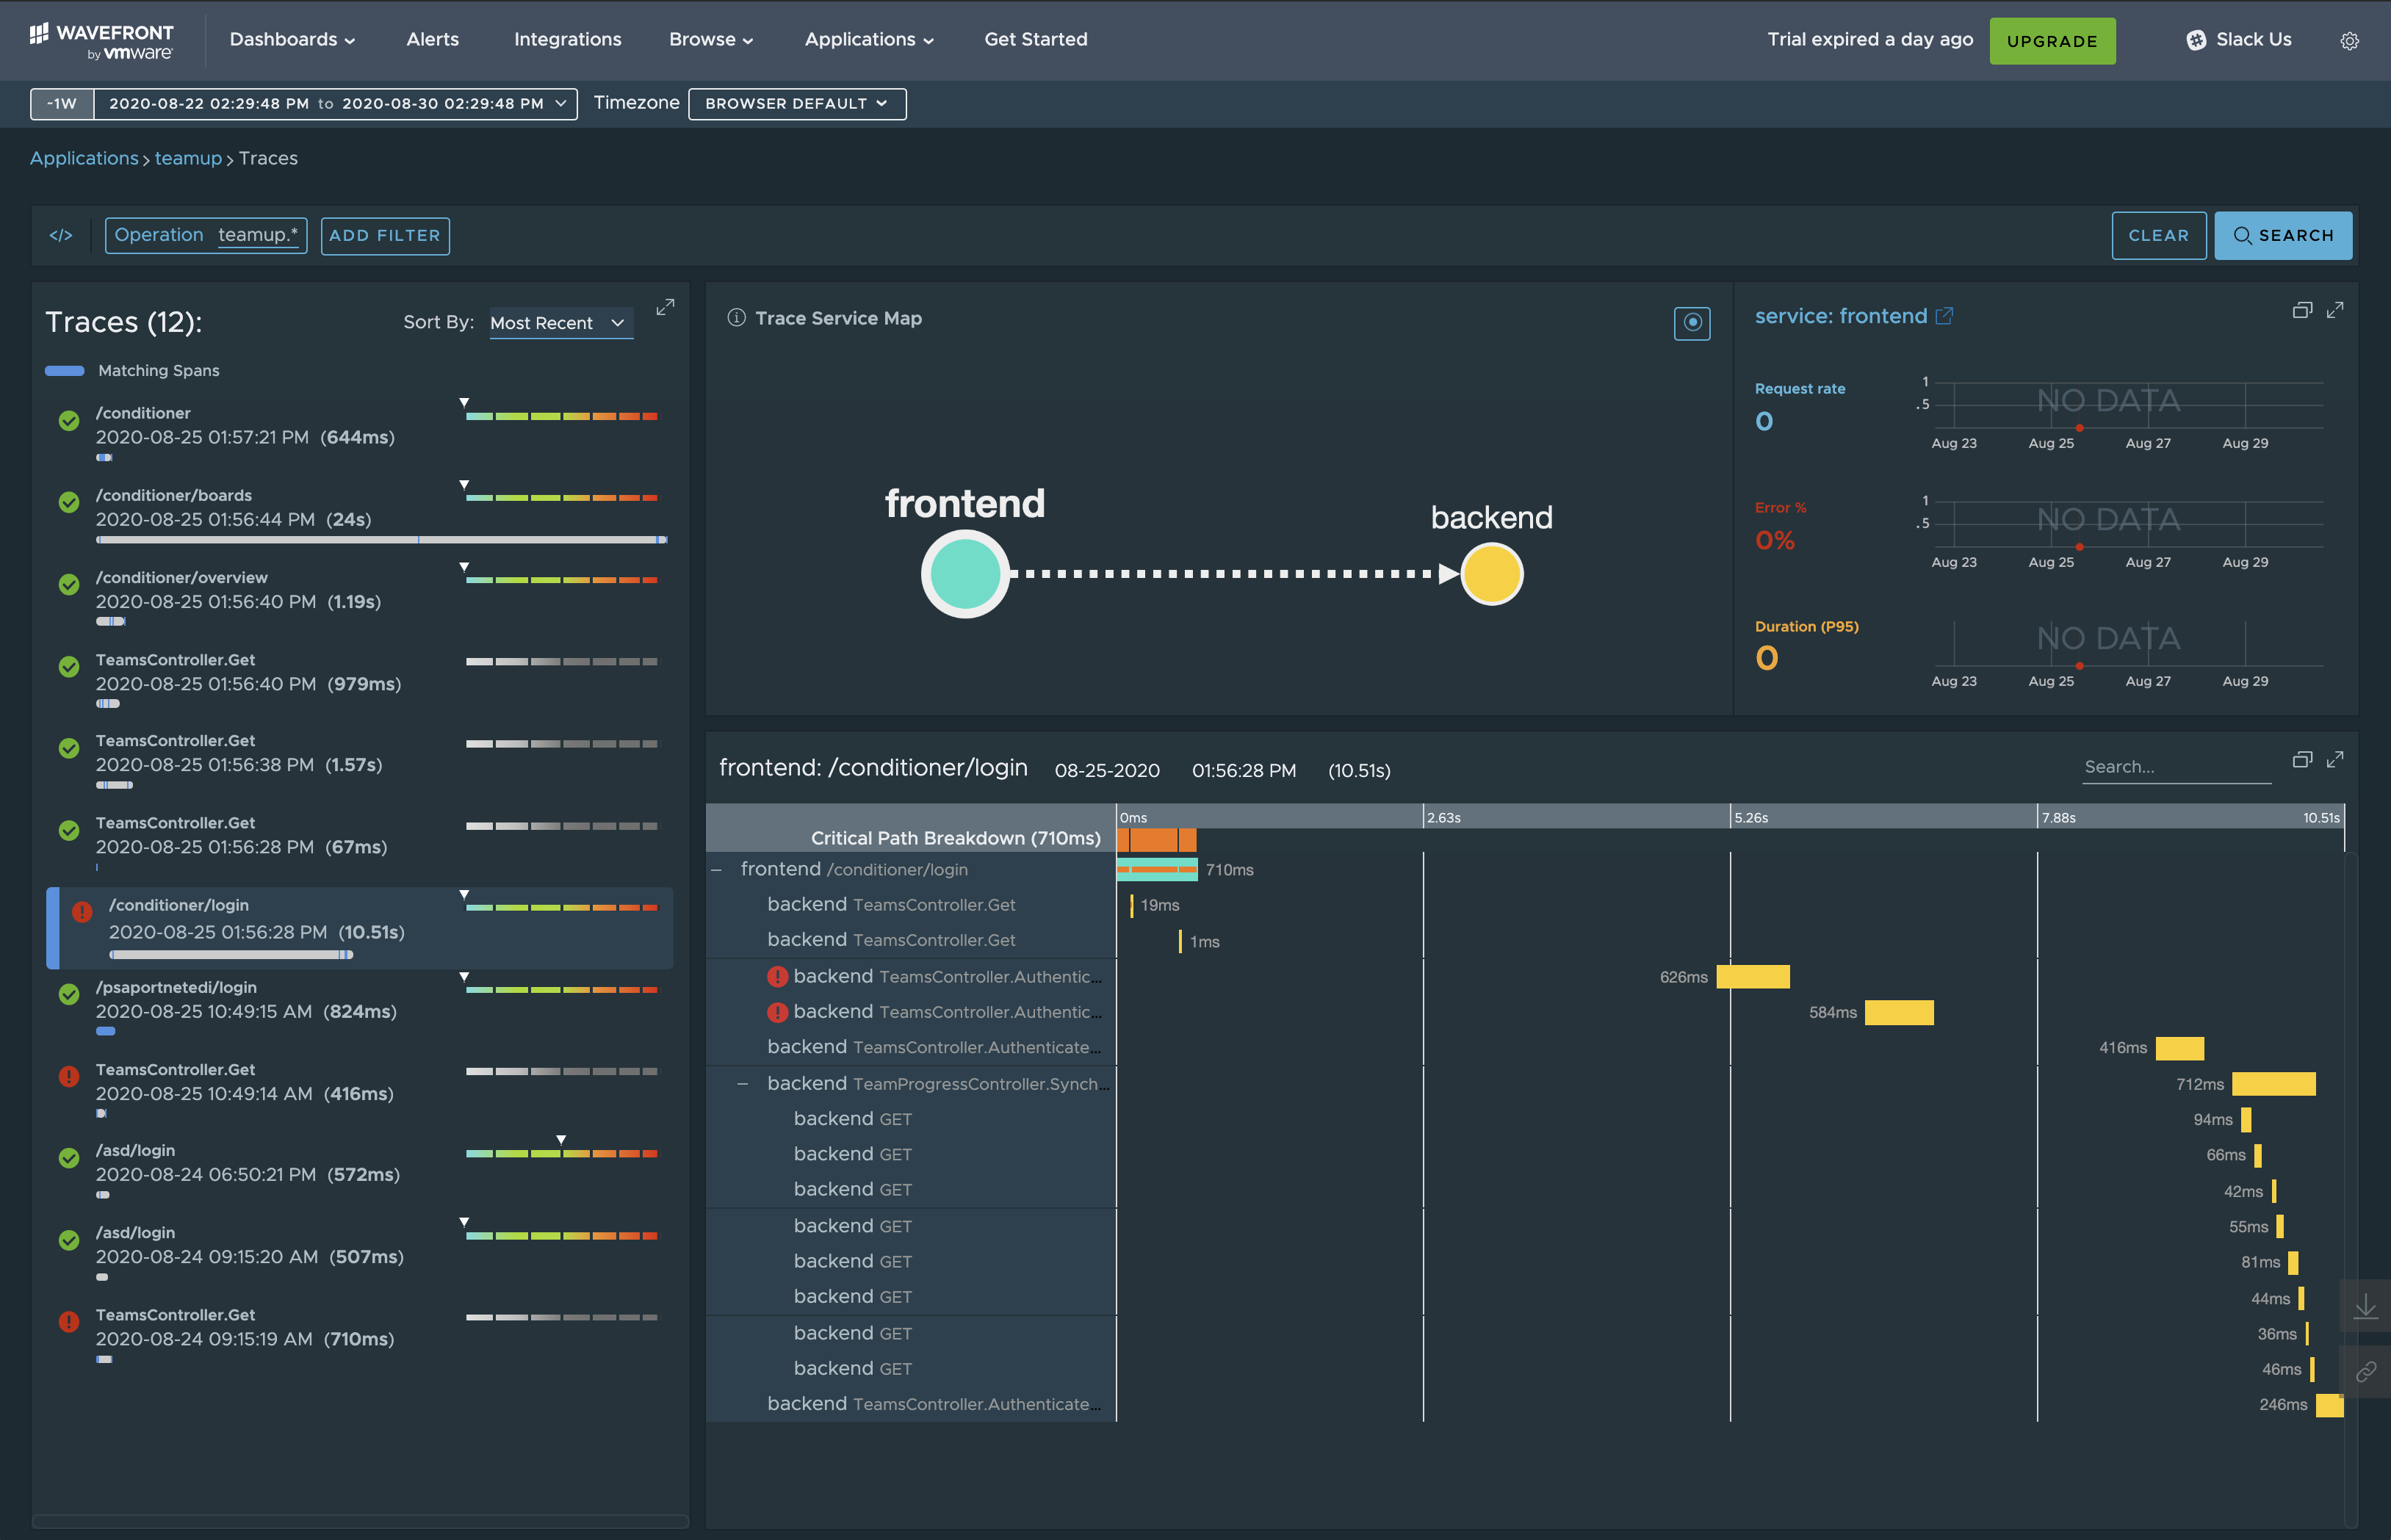
# Observability and the Frontend: ## Initial Steps <br> 8 September 2020<br> Ray / @rctay Note: Observability is an upcoming trend, tracking the take-off of microservices. For those of us working on user-facing web applications, we might have a JavaScript frontend in, say, React or Angular, that fires off calls to those systems. But, despite being the starting point of work in the backend, there is a dearth of integrations on the browser-side, compared to the backend side of things (eg. Spring, ASP.NET Core). In this talk, I'll walk through the pieces you need for browser-side integration with Wavefront by VMware. If anything, just come for the pretty graphs! --- # Introduction Note: Observability is an upcoming trend, tracking the take-off of microservices. For those of us working on user-facing web applications, we might have a JavaScript frontend in, say, React or Angular, that fires off calls to those systems. But, despite being the starting point of work in the backend, there is a dearth of integrations on the browser-side, compared to the backend side of things (eg. Spring, ASP.NET Core). In this talk, I'll walk through the pieces you need for browser-side integration with Wavefront by VMware. ## What is observability? ## Monitoring = Observability? ## Monitoring - identify symptoms of a problem ("error rate is up") - USE: utilization (free memory), saturation (CPU run queue length), errors - RED: request rate, error rate, duration of request  <!-- .element: style="max-width: 60%" --> Source: https://twitter.com/mipsytipsy/status/1231833240433917952 <!-- .element: class="attribution" --> ### Why? - with a monolith, we could use a debugger - lost that ability by breaking up the monolith into microservices Note: > "When we blew up the monolith into many services, we lost the ability to step through our code with a debugger: it now hops the network. Our tools are still coming to grips with this seismic shift." > I see a huge spike in errors at the edge at 2 p.m. today. Let’s explore. I will break down by replica set (or endpoint, or user, or literally anything, but let’s say replica set for now). Okay, there’s a huge spike in errors to replica set 1, and a much smaller spike in errors to two other replica sets, 4 and 5. Interesting. The queue lengths appear to steadily climb through the length of the spike on replica set 1, and bounce up and down through the duration on 4, and just a short spike on 5. There is a long-running query on rs1, and not the other two. I wonder if it’s a transient problem with EBS/IOPS — so I will break down by replica set node and availability zone, which shows me that they are on different AZs. Cool, ruled that one out. Is it a migration? No, the build_id didn’t change. Let me sum up the lock time being held and break down by user_id and sort to see who is holding the lock and for which query — AH! this is coming from a background expiration job from cron! It lasted longer on RS1 than RS4/5 because there was more older data there. Let’s rework it so it doesn’t have to contend for the lock in this way. <!-- .element: style="font-size: 0.48em" --> Source: [Observability — A 3-Year Retrospective](https://thenewstack.io/observability-a-3-year-retrospective/) <!-- .element: class="attribution" --> --- # Frontends and Tracing Breaking down what we have, and what we need Note: Let's take a look at the system we want to make observable, and then look at what traces in observability entail, and hopefully we can match the 2 up and have an idea of what we need to do. ## Single-page Applications  <!-- .element: style="max-width: 40%" --> Source: https://docs.adobe.com/content/help/en/target/using/experiences/spa-visual-experience-composer.html <!-- .element: class="attribution" --> Note: Let's take a closer look at a SPA, and see what kind of work is involved. One blob of html gets sent to the browser when the user first visits the page, subsequently you might go to different "pages", but the browser isn't retrieving from scratch a separate HTML, CSS, JS, it is still the same initial blob when you first visited the page. You might see different urls in the url bar, but its the code (or frontend application) in the browser that is handling these, changing what gets displayed. The idea is we just send a single blob of HTML, CSS, JS once to the browser, so we can give the user a seamless or even native feel, because any pages or data that's need are retrieved in the background, the user doesn't see a "whiteout" in the browser which you get when loading a separate page of HTML, CSS, JS. On the developer side, it opens new possibilities, like how we can preserve data or state between different pages, which is not easily done or even possible when different pages get loaded. <!-- .slide: data-background-image="/public/img/2020-09-08-observability-and-the-frontend-initial-steps/Youtube-spa-example.png" data-background-size="80%" --> Note: For the main content - you could have one API call for that, eg. For the related videos - you might have some API call for that, to load 20 related videos. And to give a seamless browsing experience, without a "blank" browser background which you see when you request a totally new page with HTML, JS, CSS, your frontend can "trap" browser navigations, so although your URL shows a different URL, the browser didn't have to request a new page with new HTML, JS, CSS. ## old I'll assume most people are familiar with routing in Single-page applications. Let's identify the unit of work to be a trace/span. ### Navigations - `/watch?v=YoZ2qY2BsMg` - `GET /api/video/YoZ2qY2BsMg` - `GET /api/related/YoZ2qY2BsMg` - `/` - `GET /api/recommendations/ray123` Note: One thing we observe is that navigating between different pages is one unit of work. For example, the 15 factor app is one page. There might be some backend calls. Navigating to the main Youtube page is another page. So now we have a rough seed or a starting point - on how we can dilenate work in our system, our picture of the system will be broken up according to a page that the user visits. any ... - Routing (in your favourite framework) - `@angular/router` - `react-router-dom` ### Tracing  Source: https://docs.wavefront.com/tracing_basics.html#sample-traces-and-spans <!-- .element: class="attribution" --> Note: Now we have an idea of what the system, single-page applicatinos, looks like. Let's now take a look at the other side of things - what traces and spans are. If you take a look at the diagram, we have a number of spans, and they are all tied together, by a trace. We can also relate spans to one another. The way the tracing platform relates spans is through a parent-child relationship. So you can report the root span to the tracing platform, then let's say for a child span, GET-style/id/make, report the child span with a parent span ID of the root span. So if you login to the tracing platform UI, it will nicely tie them together, and show this nesting hierarchy. ### Definitions - span: an individual unit of work - eg. Printing.printShirts, Packaging.giftWrap<br> - trace: an individual workflow, made up of one or more spans - eg. shopping request ### Hatching a Plan - for every navigation, start a trace - for any API calls, associate them to this trace - for any outgoing HTTP calls to external services made from within our API, associate them to this trace --- # Walkthrough ## Pieces involved - Wavefront instance and API key - ASP.NET Core backend - Angular frontend --- # Backend  <!-- .element: style="max-width: 60%" --> ## SDKs - Pick the appropriate framework SDK for your backend - Wire it up to the Wavefront instance and API key Note: I'll first start with the easy part, which is wiring up the backend. ## Startup.cs ```csharp var applicationTags = new ApplicationTags.Builder("teamup", "backend") .Build(); var wavefrontSender = new WavefrontDirectIngestionClient.Builder( "https://<instance>.wavefront.com", "<API key>") .Build(); var wavefrontSpanReporter = new WavefrontSpanReporter.Builder() .WithSource("teamup.cfapps.io") .Build(wavefrontSender); var tracer = new WavefrontTracer.Builder(wavefrontSpanReporter, applicationTags) .Build(); var wfAspNetCoreReporter = new WavefrontAspNetCoreReporter.Builder(applicationTags) .WithSource("teamup.cfapps.io") .Build(wavefrontSender); services.AddWavefrontForMvc(wfAspNetCoreReporter, tracer); ``` <!-- .element: style="font-size: 0.4em" --> ## Provided out-of-the-box - report an incoming API request as a span - report an outgoing HTTP calls as a span<br> - (bonus) metrics eg. request rate, errors ## Propagation - (crossing process boundaries) - SDK can associate span of an API request with a trace and a parent span if specified in HTTP headers - (mental note) we'll need to set these headers on frontend when making an API request to our backend ``` wf-ot-traceid: 1a2b3c4d-1839-4b39-a82a-ddb52a261e4d wf-ot-spanid: e5f6a7b8-2c39-429d-96ae-484a02db6220 ``` Note: The SDKs are also able to pick up http headers, so that it can associate API requests to the backend with a parent span. Alright, we are done with the easy part, the backend. --- # Frontend - for every navigation, create a trace/span - report this trace to Wavefront - associate backend calls with this trace ## Navigation lifecycle in Angular - `NavigationStart` - `GuardsCheckStart`: authorization / pending changes - `GuardsCheckEnd` - `ResolveStart`: pre-fetch data - `ResolveEnd` - `NavigationEnd` ## Navigation - subscribe to routing events - root span = `NavigationStart` - `NavigationEnd` - time spent in guards and resolve phases - operation: parameterized url - `/:team/overview` - tags: route parameters - `team=a-team` ## Navigation ```typescript import { Router, NavigationStart, NavigationEnd } from '@angular/router'; import { WavefrontTracerService } from './wavefront-tracer.service'; export class RoutingSubscriber { constructor(private router: Router, private tracer: WavefrontTracerService) { } subscribeToRouteEvents() { this.router.events.subscribe(this.routerHandler.bind(this)); } routerHandler(event: Event) { if (event instanceof NavigationStart) { this.tracer.startSpan(); } else if (event instanceof NavigationEnd) { this.tracer.endSpan( event.url, // operation name this.route.snapshot.params // team = 'a-team' ); } } } ``` <!-- .element: style="font-size: 0.4em" --> ## Reporting - send trace/span information to platform (Wavefront) - trace ID - span ID - operation name - start time - duration - source eg. hostname - tags eg. application, service, `cluster=prod` ## Reporting ```typescript import { WavefrontDirectClient } from 'wavefront-sdk-javascript'; import { v4 as uuidv4 } from 'uuid'; export class WavefrontTracerService { startSpan() { this.activeTraceId = uuidv4(); this.activeSpanId = uuidv4(); this.startTime = new Date().getTime(); } endSpan(operationName: string, additionalTags = {}) { this.client.sendSpan( operationName, this.startTime, new Date().getTime() - this.startTime, 'teamup.cfapps.io', // source this.activeTraceId, this.activeSpanId, null, // parent span IDs - unneeded null, // follows from - unneeded [ ['application', 'teamup'], ['service', 'frontend'], ...Object.entries(additionalTags) ], null // span logs - unneeded ); } private activeTraceId: string; private activeSpanId: string; private startTime: number; constructor(private client: WavefrontDirectClient) { } } ``` <!-- .element: style="font-size: 0.3em" --> ## Propagation - associate backend calls with trace - HTTP interceptors in Angular - set HTTP headers `wf-ot-traceid` and `wf-ot-spanid` ## Propagation ```typescript import { WavefrontTracerService } from './wavefront-tracer.service'; import { HttpInterceptor, HttpRequest, HttpHandler, HttpEvent } from '@angular/common/http'; import { Observable } from 'rxjs'; /** As seen in TextMapPropagator in https://github.com/wavefrontHQ/wavefront-opentracing-sdk-java/ */ const BAGGAGE_PREFIX = 'wf-ot-'; const TRACE_ID = `${BAGGAGE_PREFIX}traceid`; const SPAN_ID = `${BAGGAGE_PREFIX}spanid`; export class WavefrontHttpInjectorService implements HttpInterceptor { constructor(private tracer: WavefrontTracerService) { } intercept(req: HttpRequest<any>, next: HttpHandler): Observable<HttpEvent<any>> { const updatedReq = req.clone({ setHeaders: { [TRACE_ID]: this.tracer.getActiveTraceId(), [SPAN_ID]: this.tracer.getActiveSpanId() } }); return next.handle(updatedReq); } } ``` <!-- .element: style="font-size: 0.35em" -->  Note: (demo time, screenshot here in case demo fails) --- # Conclusion - starting point for getting data from the frontend - other ideas - rendering time - however DomContentReady / `timing_first_contentful_paint_ms` is only for first load - other significant user interactions, eg. form submissions Note: Hopefully you are now able to have a more complete picture of work in your system. <!-- .slide: data-background-image="/public/img/2020-09-08-observability-and-the-frontend-initial-steps/Tutorial-Adding-distributed-tracing-instrumentation.png" data-background-size="50%" --> ## Q&A ## References / Further reading - https://cloudblogs.microsoft.com/opensource/2019/02/28/tutorial-adding-distributed-tracing-instrumentation-to-browser-javascript-app/ - There isn't much on observability on frontend, if you google you'll land on this. - A lot of ideas from this talk is from that blogpost, eg. using root span = navigation, discussion of other granularities of a span, such as session lifetime. - https://charity.wtf/2020/03/03/observability-is-a-many-splendored-thing/ - tweetstorm from another person who did "observability" but turned out wasn't - [Observability — A 3-Year Retrospective](https://thenewstack.io/observability-a-3-year-retrospective/) - Cardinality and Its Relation to Complex Distributed Systems - What Observability Looks Like in Practice - Observability and Its Progenitors - The Future of Observability - [Monitoring and Observability](https://medium.com/@copyconstruct/monitoring-and-observability-8417d1952e1c) - Baby’s first Observability - Monitoring is for symptom based Alerting - And then there’s “Observability” - Debugging - https://docs.honeycomb.io/getting-data-in/javascript/browser-js/ - ideas for other things to instrument - non-framework specific ## End